“If I am given six hours to
chop down a tree, I will spend
four hours sharpening the axe.”
- Abraham Lincoln -
Helping your employees to feel like they are important members of your organization can be a major motivational tool. There are many strategies furniture retailers use to involve and motivate, but an important and often overlooked one, is to share financial information with them about how your business performance is trending. Here we will discuss how Parallel Performance Trend Analysis® (PPTA) can be used to easily and effectively share financial information.
Retail Furniture Store Forecasting
PPTA requires that you have a business forecast to act as a baseline measure for the trend analysis. Many analysts suggest that a major reason businesses fail is that they fail to plan. This isn’t surprising. Time constraints and work-load demands on today’s furniture retailers are such that many managers are so consumed with daily operations that they believe there is little time for planning.
Leisurely budget reviews are no longer a viable option for the successful executive. Instead, accurately estimating forecasted revenues which are underwritten by planned expenditures is a critical step in managing both cash flow and cash velocity.
Cash is King
Some suggest all other areas of financial management are secondary to precise cash projections. If planned expenditures are not predicated on a realistic analysis of anticipated revenues, many retailers know from hard experience that they can be left struggling to meet financial commitments as obligations come due.
Few if any managers can be totally accurate in forecasting financial budgets. Retailers stock, staff and spend in anticipation of projected sales, but have limited control over competition, the economy, consumer consequences. When a competitor enters or leaves the area, introduces products or promotions, forecast may be significantly effected.
Even so, realistic forecasting is a vital and necessary role of management. Forecasting too optimistically may leave us with inordinate inventory, disproportionate investment in labor costs, excessive commitment to promotion and financial obligations to infrastructure growth.
Parellel Performance Trend Analysis Creation
Cash flow statements are invaluable in responding to immediate trends. However, these documents are frequently proprietary in nature and not readily shared beyond the corporate boardroom. So, how can you share financial information in a meaningful way with employees across your organization without giving away too much? The answer is by showing trends without using dollars and cents.
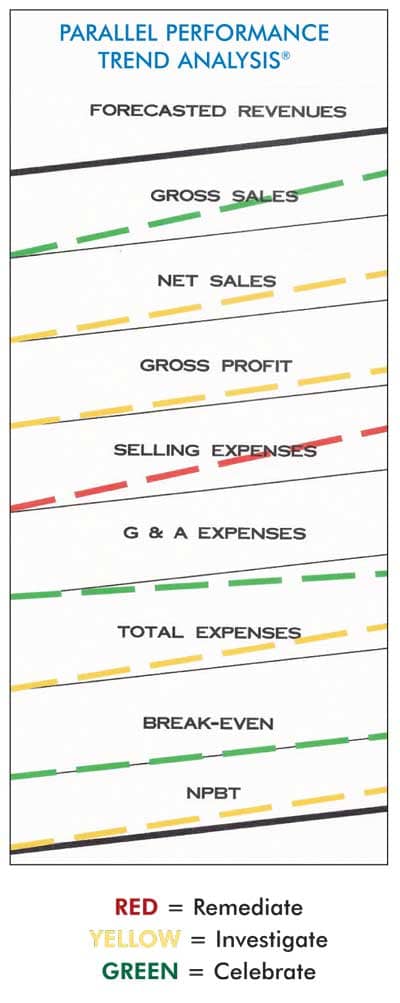
The key indicator shown on the Parallel Performance Trend Analysis chart at left is forecasted revenues. When performance parallels the forecast, employees can see that the company is “tracking” in the right direction. The report format also enables managers to identify and employees to expect corrective action on adverse trends and ratios.
Metrics To Display: Areas of activity that can be visually evaluated for Parallel Performance are:
- Gross Sales vs. Forecasted Sales.
- Net sales vs. Forecasted
- Net Sales.
- Cost of Goods vs. Forecasted Cost of Goods.
- Gross Profit vs. Forecasted Gross Profit.
- Selling or Variable Expenses vs. Forecasted Selling Expenses.
- Fixed or General and Administrative Expenses vs. Forecasted Expenses.
 Visual Format:
 The Parallel Performance Trend Analysis acts as a business compass, visually illustrating deviation from the projected or forecasted norm.
Educators understand the impact of visuals in the learning process. Some suggest we are 8 times more effective in the selling situation when we use visual aids. The same is true when we encourage associates to buy into our attainment of goals through participative management.
Distribution: Posting performance trends throughout the organization encourages everyone to feel as though they are members of the management process at all levels. It serves as “soft” reminder of the need to meet expectations without harassment or personal chastisement.
It is not necessary to show actual numbers to meaningfully illustrate areas of performance that reflect excellence or require revision.
Timing: Preparing and distributing quarterly Parallel Performance Trend Analysis reports rather than waiting until year-end insures that employees feel good about excellent performance and will be informed when management takes corrective action. Quarterly reports also eliminate monthly spikes or aberrations.
Explanation: Distribute the Parallel Performance chart for all associates to see. If you feel it is necessary to verbally explain how the report tracks trends, you can do so in just a few minutes.
Ralph Waldo Emerson said: “This time like most times is a very good time if we know but what to do with it”.
Color Coding: The illustration can be made more meaningful by utilizing color on the analysis chart.
Retail Forecasting
Psychologists advise the average person works at 30% of their physical capacity. Surveys suggest 57% of our work force indicate they can be more productive.
Retail managers who want to raise productivity levels should consider taking steps to let their workforce know the reasons for policy changes.
Managers that isolate themselves from the employee population fail to take advantage of the motivational tools to raise the levels of performance.
Charles Schwab, former President of U. S. Steel, was the first U.S. executive to make a million dollar salary.
With nothing more than a piece of chalk, he wrote work performance for each shift on a sidewalk as steel workers entered the plant. That simple visual resulted in a 66% increase in productivity in one weeks time.
If Charles Schwab could motivate with a piece of chalk, we can achieve similar results with a Parallel Performance Guide.
The Parallel Performance Guide is a simple but effective tool that requires minimal time but has maximum managerial impact, most of which is to protect the bottom line.
What happens if we miss our goals or forecasts? Don’t sanitize the situation. Step back and start over.
Failing is not fatal. We learn more from our failures than our successes. In the words of Lee Iacocca: “So what do we do? Do anything. So long as we don’t just sit there. If we screw up, start over. Try something else. If we wait until we’ve satisfied all uncertainties, it may be too late.”
Like Deming said, “Plan, do, study.” Or, evaluate with the Parallel Performance Trend Analysis, then act.
Ray Morefield has been affiliated with leading corporations in the housewares, hardware and coatings industries. He has also served other industries in an advisory capacity through Common Goals, Inc. Questions or comments can be sent to him by emailing editor@furninfo.com.