Retail Media Note #168: How Spending Patterns Differ By Generation
Furniture World News Desk on
10/15/2018
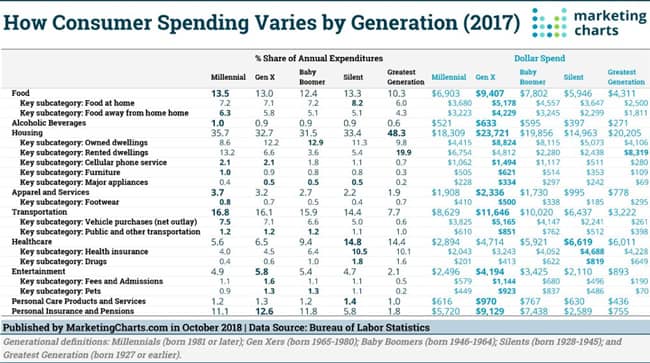
Gen Xers (born 1965-1980) had the highest average income before taxes last year, of roughly $95k, according to the latest annual Consumer Expenditure Survey from the Bureau of Labor Statistics, and they averaged the most spending, too. But how do different generations apportion their spending? Let’s take a look at a few key areas.
How Consumer Spending Varies by Generation
The following breaks down some (but not all) major spending areas as defined in the data, along with some differences between generations.
Food
When it comes to food – which includes food both at home and away from home – it’s Millennials (born 1981 and later) who dedicate the largest share of their expenditures. There aren’t large differences among generations, but Millennials allocate 13.5% of their expenditures to food, compared to 12.9% for adults overall.
However, as a result of their large incomes and expenditures, it’s Gen Xers who spent the most on food last year in dollar terms. This cohort averaged $9,407 spent on food, with Baby Boomers the next-highest spenders ($7,802), followed by Millennials ($6,903).
Looking specifically at food away from home, the trends largely stay the same. Spend share is highest for Millennials, who devote 6.3% of their expenditures to food away
from home. That compares with 5.8% for the next cohort, Gen Xers, and to 5.6% for adults overall.
In dollar spend, it’s Gen Xers leading the way on spending on food away from the home, with an average of $4,229. Baby Boomers ($3,245) and Millennials ($3,223) are virtually tied.
If you’re keeping count, that means that Gen Xers spend an average of around $350 per month on food away from home, compared to around $270 for Millennials and Baby Boomers.
Home Furnishings
Millennials are the largest group for furniture with a 1.0% share of annual expenditure. However, Gen Xers (born 1965-1980) lead in dollar spend ($621) compared to Millennials ($505). While both are double what they spend on major appliance, it is 1/2 to 1/3rd of what they spend on cellular phone service.
Baby Boomers (born 1946-1964) are the second biggest group to spend on furniture with an average spend of $514.
The Silents (born 1928-1945) average $353 on furniture while the Greatest Generation invests $109 on furniture.
Housing
The housing category includes shelter (owned dwellings, in turn including mortgages, taxes, insurance and other expenses), rented dwellings, other lodging, utilities, household operations, household supplies, and household furnishings and equipment. In terms of the overall category, housing hogs the biggest budgets for the Greatest Generation, born earlier than 1927. These adults allocate a staggering 48.3% share of their annual spending to housing.
Next on the list are Millennials, who devote more than one-third (35.7%) of their expenditure to housing. The biggest spenders in dollar terms are again Gen Xers ($23,721 annually) as a result of their higher income and spend.
Looking at some housing sub-categories, we can see that:
- The Greatest Generation spends the most on rent ($8,319; 19.9% expenditure share), followed by Millennials ($6,754; 13.2% expenditure share); while
- Gen Xers spend $1,494 on cell phone services annually, compared to $1,117 for Boomers and $1,062 for Millennials, with the resulting spend share being equally high among Gen Xers and Millennials (2.1%).
Apparel and Services
Are Millennials big spenders on clothing and footwear? Indeed.
While their average spending ($1,908) is again outpaced by Gen Xers ($2,336), Millennials devote the largest share of their expenditures (3.7%) to apparel and services, with Gen Xers (3.2%) next.
There appears to be a strong correlation with age, with spend share for apparel and services declining alongside increasing age.
As regards footwear, it’s a similar story with Gen Xers leading the way in dollar terms ($500) and Millennials in spend share (0.8%).
Transportation
Millennials spent 16.8% of their expenditures last year on transportation, per the data, slightly ahead of Gen Xers (16.1%) and Baby Boomers (15.9%).
Somewhat surprisingly, those patterns didn’t always hold true when sorting by transportation type. Millennials, Gen Xers and Baby Boomers each allocated an equal share (1.2%) of their spending to public transportation and transportation other than vehicle purchases.
And while there’s been plenty of talk about youth and their impact on the auto industry, Millennials last year spent a larger share of their total annual expenditures on vehicle purchases (7.5%) than any other generation. Of course, this was due to their income and spending being smaller, as Gen Xers spent far more on average for vehicle purchases ($5,165) than Millennials ($3,825).
Healthcare
Here’s one area where Millennials aren’t the heaviest spenders. Instead, spending on healthcare logically increases with age, though there’s a slight drop-off after the Silent generation (born 1928-1945).
Silents allocated the largest share of their spending (14.8%) to healthcare and also spent the most on a dollar basis ($6,619) last year. By comparison, Millennials spend a far smaller share of their expenditures (5.8%) on healthcare, and the smallest amount of any generation ($2,894).
Entertainment
This category encompasses the following sub-categories: Fees & admissions; Audio and visual equipment and services; Pets, toys, hobbies and playground equipment; and Other entertainment supplies and services.
Gen Xers are the largest spenders on entertainment, allocating 5.8% of their spending, or $4,194 annually. Baby Boomers are the next-largest spenders, at 5.4% of expenditures and $3,425 on average.
The gap between Gen Xers and others is particularly acute for the Fees and admissions subcategory. Gen Xers splurge here, spending 1.6% of their expenditures, far above Millennials and Baby Boomers, at 1.1% each. In dollar terms, the $1,144 spent by Gen Xers is considerably higher than the $680 spent annually by Baby Boomers and is about twice the $579 spent by Millennials.
Personal Care Products and Services
Finally, how about personal care? Spend share is actually highest in this category for the Silent generation, which devoted 1.4% of its spending to personal care products and services last year.
Gen Xers (1.3%) were next, followed by Millennials and Baby Boomers (1.2% each). Dollar spending on personal care products and services was highest for Gen Xers ($970), followed by Baby Boomers ($767), while Millennials spent $616 on average.
How Spending Patterns Differ By Generation
By Lance Hanish
Lance Hanish is Co-Founding Partner in CNA|Sophis Integrated Marketing Solutions one of the leading marketing firms serving the home furnishings industry. An award winning writer, director, producer and advertising/ marketing consultant, he can be reached at:
(480) 619-8999
eMail: Lance@CNASophis.com
Facebook: https://www.facebook.com/CNASophis
Twitter: https://twitter.com/sophis1234
On Google+:https://plus.google.com/+cnasophis
On LinkedIn:Lance Hanish http://bit.ly/2j5yUJS
On Pinterest http://pinterest.com/sophis1234/
MOBILEFirst is a trademark of CNA|SOPHIS Integrated Marketing Innovation 2017
For more information regarding Integrated Marketing Innovations, read Media Notes Canonical at http://www.cnasophis.com.
For daily media notes, read our blog at http://overtheshouldermedia.wordpress.com.
For weekly Media Notes Briefs, read our blog at http:// sophis1234.tumblr.com.
For more information on CNA | SOPHIS, simply scan the QR Code below on your smart mobile device.