Weekly reports help identify problems, cut delivery costs, motivate driver teams and design effective incentive programs.
Warehouse & Delivery By Dan Bolger, P.E.
Most successful furniture retailers carefully track sales metrics. They have all the numbers at their fingertips; ups per hour by day, close rates, average sale, sales data by individual person, and many more. In addition, retailers participating in performance groups compare components of their financial reporting with similar business.
In contrast, warehouse and delivery metrics rarely attract this level of attention. Many managers think of warehouse operating statistics as a “black hole”. They want meaningful information that can be used for continuous improvement, but don’t know how to go about getting it from beyond the event horizon. The problem is made worse by the fact that neither of the two national annual surveys provide sufficient data for benchmarking their operations.
It is an age old fact that you cannot manage what you do not measure. A metric is simply a standard measure that can be used to assess performance in a particular area. Metrics are at the heart of any good, customer-focused process management system and any program directed at continuous improvement. Warehouse and delivery metrics should focus on criteria that will help you meet customers’ needs and achieve your business objectives.
Many years ago I was introduced to the SMART approach to performance improvement. Measurements must be Specific to the target area where improvement is desired. They must be Measurable so you can easily collect accurate data. They must be Actionable so you can easily spot the direction. You only want to track data that is Relevant. A common error is to measure everything and that results in tons of useless data. Timely metrics are important so you have the results needed to make prompt improvements. The Perfect Delivery Index uses these SMART principles.
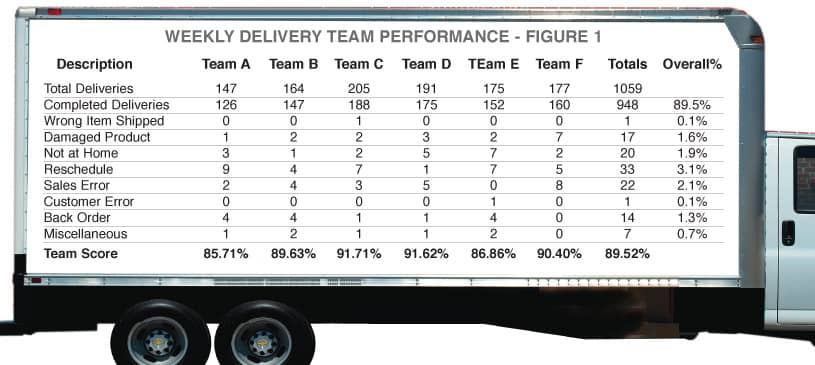
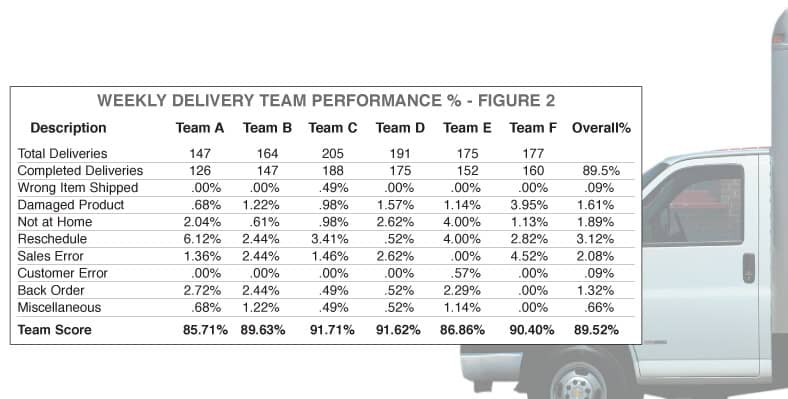
The metric shown below in FIGURE 1 is the Perfect Delivery Index for a well known furniture retailer. Data is arranged by delivery truck and covers a one week period. The same data showing percentage figures can be found in FIGURE 2. This data was collected from a line on the driver’s manifest that contained check boxes for the eight problem categories:
- Wrong Item Shipped: The item delivered wasn't what was specified on the manifest.
- Damaged Product: Item was damaged.
- Not at Home: No one was at home to accept delivery of the merchandise.
- Reschedule: Delivery cancellation was received after the merchandise was pulled.
- Sales Error: Item was correct per the manifest but wasn't what the customer ordered.
- Customer Error: For example, a customer ordered an item too big to fit through hallway.
•Back Order: Order not shipped complete.
- Miscellaneous: For example, could not deliver order because the road was closed due to traffic accident.
The data, including Total Deliveries (Total number of orders on the delivery manifest) and Completed Deliveries (Total orders were are delivered without any exceptions) was inserted into an Excel file by the administrative staff and reports were distributed to key managers.
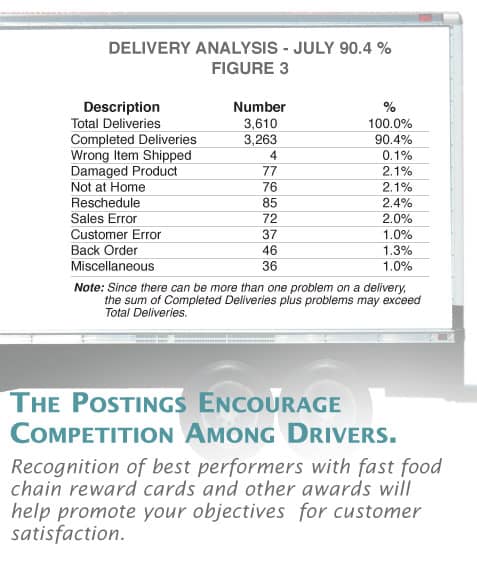
It is important to note that some of the line items that make up the Perfect Delivery Index are outside the warehouse manager’s control but reflect on the customer perception of the retailer. Delivering a damaged piece or shipping the wrong item is clearly the warehouse manager’s responsibility. The manager is not accountable for sales or customer errors. Accountability for re-schedules, not-at-homes and back orders depend on the retail organizational structure. Regardless of accountability, costs that result from delivery inefficiencies become a warehouse responsibility. The summary data shown in FIGURE 3 (July Delivery Analysis) is representative data from a major furniture retailer. The overall Perfect Delivery Index was 90.4 %. In today’s competitive environment, that is unacceptable. Realistic goals are above 95% and best performers approach 97% or more.
Motivating your team
Taking the time to compile and post weekly reports for individual driver/helper teams can be very useful for motivating teams and designing incentive programs. Posting these results will encourage teams to do a better job of inspecting merchandise before loading and properly blanket wrapping items to prevent damage. When trucks are pre-loaded by warehouse crews this job becomes a shared responsibility.
Experience has shown that the postings encourage competition among drivers. Recognition of best performers with fast food chain reward cards and other awards will help promote your objectives for customer satisfaction. The data also provides specific grounds for retraining delivery teams that consistently are in the bottom half for shipping accuracy, damaged items and not at homes. Any warehouse manager looking at the data in FIGURE 2 would immediately want to find out why delivery team F had damage on 3.95% of their orders when the other four teams ranged from .68% to 1.22%
A similar approach can be used with sales associates. You will probably find that certain sales people will have very few “sales errors”, while a few will be responsible for the majority. Again, this tool provides a mechanism to assign responsibility for a range of performance. Specific coaching guidance and incentives to correct poor results can be built into your sales management systems.
Getting back to the specific example in the July summary report, every measure had room for improvement. The 4.5% combination of “Reschedule” and “Not-at-Home” was deeply disturbing. A reschedule is a situation where the product may have already been prepped and staged for loading or had to be pulled off a loaded truck. A not-at-home” is even worse due to the increased potential for product damage during the ride along the truck route and back to the warehouse. Damage due to not-at-homes increase significantly when the first stop is missed and the undelivered item must be handled at subsequent stops. Slower deliveries and increased handling costs on the truck result. Back at the warehouse, the item needs to be reconciled, re-inspected, stored, and re-delivered. The entire profit margin may be lost on a not-at-home.
The bottom line is that taking the time to compile and use a Perfect Delivery Index is appropriate for retailers committed to a continuous improvement program. In a future article Perfect Delivery Index data will be presented from multiple retailers with the goal to provide effective benchmarks. Comments and suggestions from FURNITURE WORLD Magazine readers are encouraged as we strive to achieve high customer satisfaction and gain competitive advantage.
Practical steps you can take to improve delivery satisfaction are available from a prior FURNITURE WORLD article, “The Less Than Perfect Furniture Delivery”, posted to the operations article archives on www.furninfo.com.
Daniel Bolger, P.E. provides operations consulting services to clients throughout North America. You can contact Dan at bolger@furninfo.com for more information on this or other transportation, logistics and furniture warehousing topics. Go to www.furninfo.com to read all of Dan’s articles on transportation, logistics and warehousing.