You have been entering sales and cash transactions, recording costs, counting your inventory, keeping track of customers, and paying taxes, right? All business activity produces data. No matter which software system you are running, you have thousands of report queries available. How you sift through this data and make sense of it all is the purpose of business intelligence or “BI”. Your ability to organize, maintain and functionally use the information that you have collected determines its value to your organization. In this article I’ll discuss how BI can work for you.
FOCUS ON FURNITURE METRICS FIRST
Business managers who spend their time taking actions based on the most important metrics have a better chance of producing results. Those managers that have trouble getting the right information are those that operate more by the seat of their pants. Ask yourself, "Do I feel as if I am running my business" or, "Do I feel as if my business is running me?” Are you in control of your situation or are things a bit out of your control? If you have good BI that is easy to read, you can focus. You can control your direction better.
HOW BUSINESS INTELLIGENCE WORKS
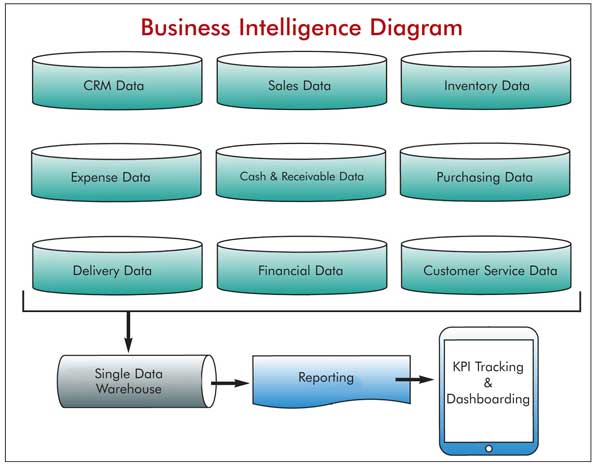
You have data that comes from recording various business activities. For example, CRM data (Customer Relations Management) contains information on the number of customers who have visited your business, your salespeople’s interactions with them, the sales result and the follow up performed. The Sales data contains information on the size of the transactions and the specific inventory purchased. And, the Inventory data includes stock counts, location tracking and the age of merchandise. There are literally thousands of other pieces of information in these and many other data files.
A good Business Intelligence system brings all these data sources together in one single data warehouse. Within this warehouse various files or sources are reportable together (see illustration).
The Business Intelligence system gathers all this information and generates the most useful metrics. By running the report queries correctly, the most critical information is looked at first. Significant time is saved by giving managers tools that they can use to make the best decisions, fast.
Finally, today’s technology allows the BI to be compiled into dashboards and viewed conveniently from any device at any time. In the old days of computing, I witnessed the desks of managers with stacks upon stacks of paper reports that piled up over months. In fact, I witnessed one gentleman get so overwhelmed by what was in front of him that he had a panic attack and threw everything in the garbage with one swoop.
Today, all you need is an iPad with the most relevant information organized in a single file for easy viewing. The CEO performance groups that I direct use what we call an FMA (Financial Metrics Analysis). The members view all of their critical data on a dashboard-type display.
Consequently, they have a much better finger on the pulse of their business than their competition. That is how BI helps.
DASHBOARD INFORMATION
Here is some of the information that I suggest you get from your business intelligence system and put on your dashboard. Of course, you should customize your BI for your unique situation and needs:
CRM Data
- Customer traffic/selling opportunities.
- Close rates.
- Revenue per opportunity
- Follow up percent.
Sales Data
- Average sales.
- Written sales & Delivered Sales.
- Gross Margin & sales by salesperson.
Inventory Data
- Average inventory.
- Inventory to Sales ratio.
- GMROI (gross margin return on inventory).
- Best Selling – Vendors, Categories, Groups, Items.
- Merchandise not on display percent.
Expense Data
- Expense by Category – administration, occupancy, marketing, selling, service, warehousing, distribution, finance & banking.
Cash and Receivables
- Reconciled balances.
- Accounts receivable.
- Customer deposits.
- Quick Ratio, Current Ratio, Working Capital.
Purchasing Data
- Best Seller in-stock percentage.
- Lead days.
- Inventory turns.
Delivery Data
- Percent of deliveries scheduled.
- Perfect delivery percentage.
Customer Service Data
- Percent of service issues per sales.
- Vendor credit requests.
- Source of issues.
Financial Data
- Financial Performance: Profit & Loss, Balance Sheet, Cash Flow.
- Performance to plan or budget.
- Comparative to prior periods.
CONCLUSION
You are data rich. There is a lot you can do with it. There are new business intelligence tools and services springing up every day with the fast pace of today’s technology. If you don’t want to do it on your own, find a partner who is knowledgeable in the BI metrics that your business needs and can help you take the proper actions to improve. Make your data and business work for you.